
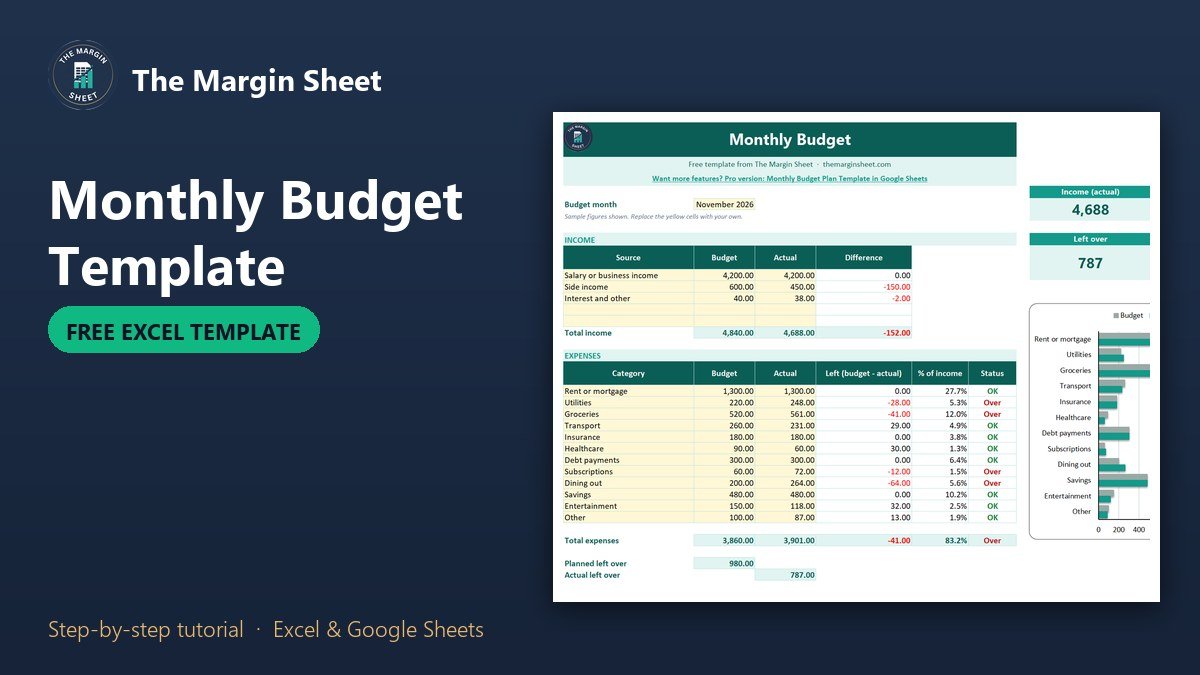
A monthly budget template for Google Sheets is a one-page spreadsheet where you list what you plan to earn and spend, enter what actually happened, and let formulas show the difference. To build one, set up income and expense tables with Budget and Actual columns, subtract to get what is left, and flag any line where Actual is bigger than Budget. The free template below does all of that and opens in Google Sheets or Excel.
Free download
Monthly Budget Template (Excel / Google Sheets)
Working formulas, sample data and a How to use sheet. Opens in Excel, or import it into Google Sheets.
What this monthly budget template does and who it is for
This is a free monthly budget spreadsheet for people who want a clear answer to one question: did I spend what I planned? It suits households, freelancers who keep personal and business money apart, and anyone who has tried an app and prefers to see the numbers in a sheet they control.
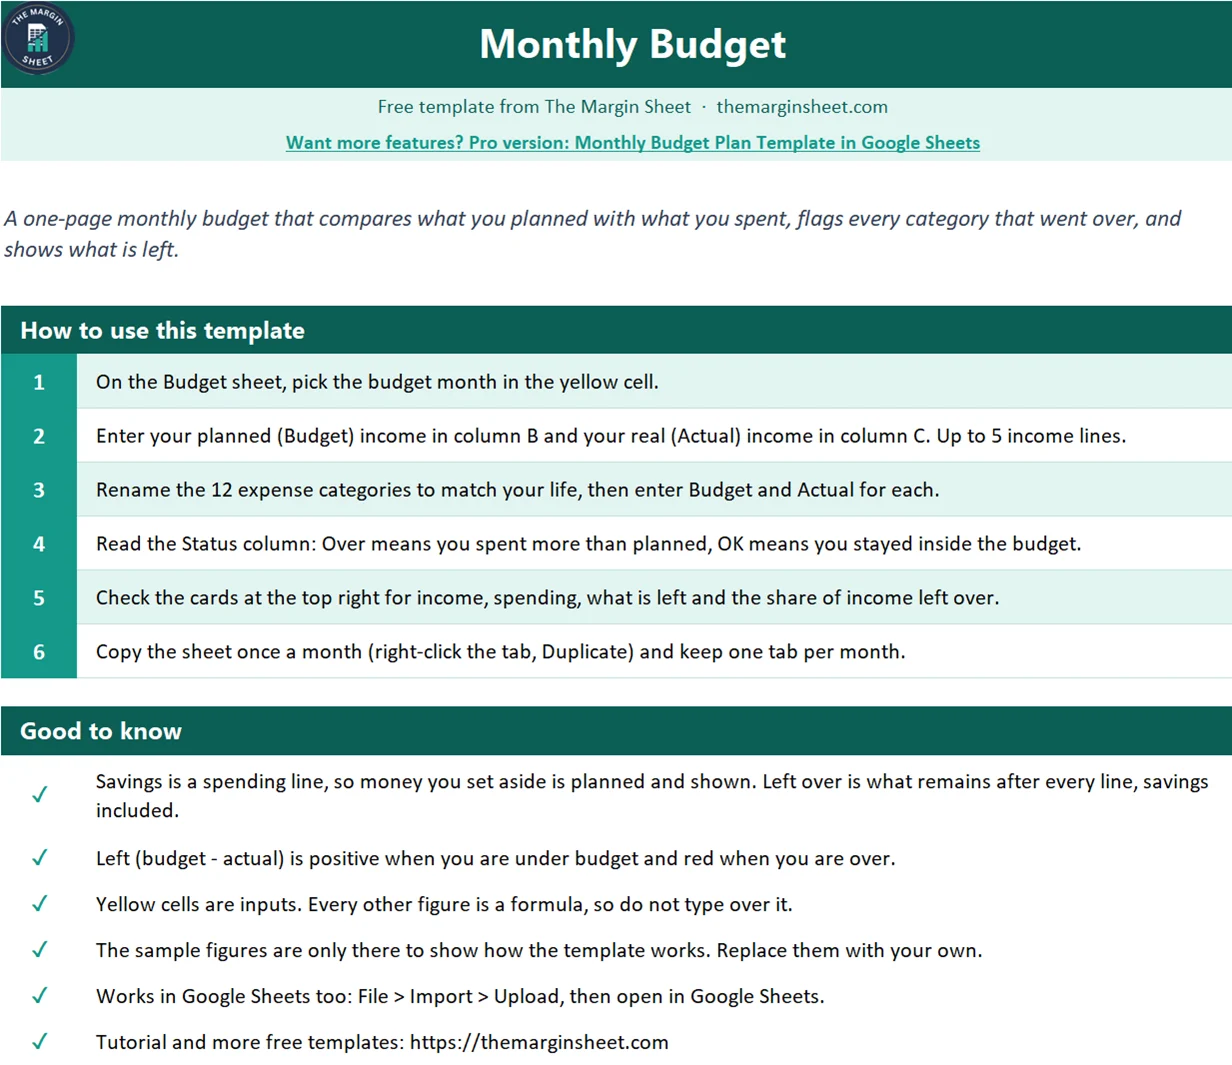
The file has two sheets, How to use and Budget. The Budget sheet has an income table with five lines, an expense table with twelve categories, four summary cards and a bar chart that puts budget and actual side by side. Yellow cells are inputs. Everything else is a formula, and there are no gridlines, so it prints cleanly on one landscape page.
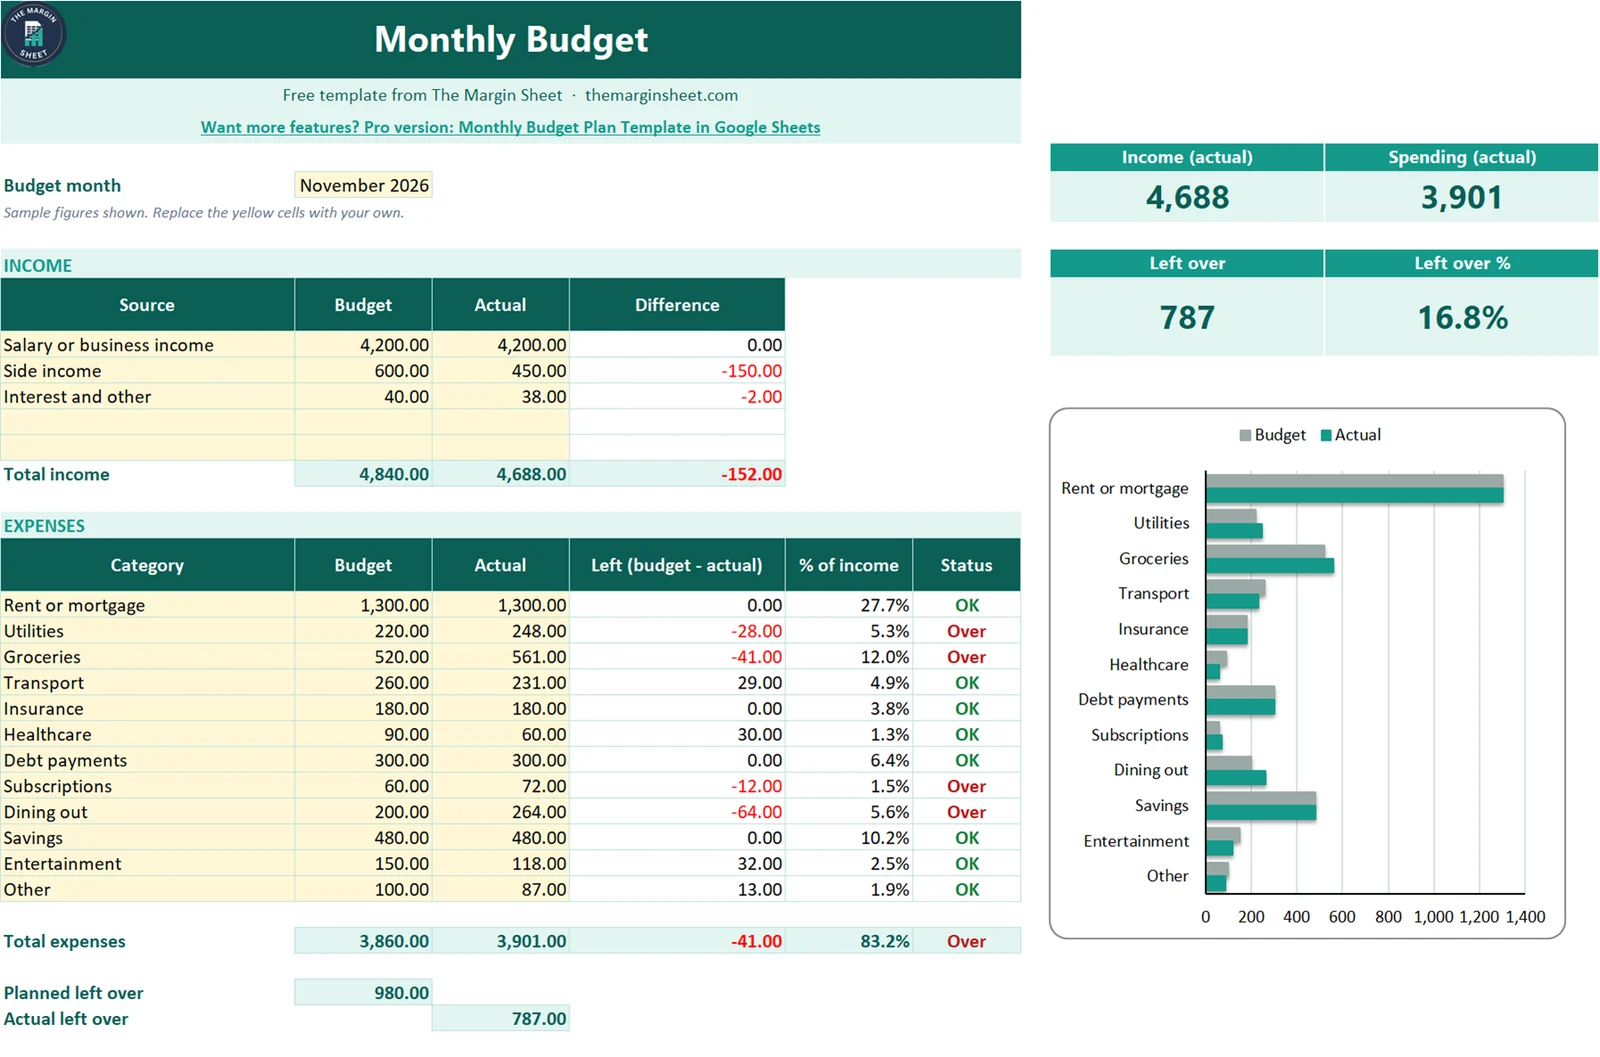
The sample figures show a realistic month: income a little under plan, four categories over budget and the rest inside it. Replace them with your own numbers and the sheet recalculates at once.
What is on the Budget sheet
Each block sits in a fixed place, so it is easy to find your way around. The table lists the blocks and their cells.
| Block | Cells | What goes there |
|---|---|---|
| Budget month | B5 |
The month you are planning (sample: November 2026) |
| Income table | A10:D14 |
Source, budget, actual and the difference |
| Total income | B15:D15 |
=SUM(B10:B14) and the same for C and D |
| Expense table | A19:F30 |
12 categories with budget, actual, left, share of income and status |
| Total expenses | B32:F32 |
Sums, share of income and an overall Over or OK |
| Planned left over | B34 |
=B15-B32 |
| Actual left over | C35 |
=C15-C32 |
| Summary cards | H4:K11 |
Income, spending, left over and left over as a share of income |
| Chart | H13 |
Budget vs actual for each expense category |
How to open it in Google Sheets or Excel
In Excel, open the file as normal. In Google Sheets, go to Google Drive, choose New, then File upload, and open the uploaded file with Google Sheets. If you are already inside Sheets, use File > Import instead. The formulas, the Over and OK colors and the chart all carry across.
Make a copy before you start typing so you always have a clean original. Then plan to duplicate the Budget tab once a month, so each month keeps its own record.
How to make a monthly budget in Google Sheets: step by step
You can download the file and skip the build, or follow these steps to understand every part and make your own version from a blank sheet.
Step 1: Set up the income table
Type the month in B5 and format it as a date such as November 2026. In row 9 add the headers Source, Budget, Actual and Difference. Rows 10 to 14 give you five income lines, for example salary or business income, side income and interest. Enter your planned amount in column B and the real amount in column C.
Step 2: Calculate the income difference
In D10 enter:
=IF(C10="","",C10-B10)
The IF wrapper keeps the cell empty until you type an actual amount, so unused rows stay clean. Copy it down to D14. For income, a positive difference means you earned more than planned. In row 15 use =SUM(B10:B14) in B15 and copy it across to C15 and D15.
Step 3: Build the expense table
In row 18 add the headers Category, Budget, Actual, Left, % of income and Status. List twelve categories in A19:A30, such as rent or mortgage, utilities, groceries, transport, insurance, healthcare, debt payments, subscriptions, dining out, savings, entertainment and other. Rename them to fit your life. Keep Savings as its own line, so the money you set aside is planned and visible.
Step 4: Add the three expense formulas
In D19 enter the amount left in the category, budget minus actual:
=IF(C19="","",B19-C19)
In E19 enter the share of income the category takes, and format the cell as a percentage:
=IF(OR(C19="",$C$15=0),"",C19/$C$15)
The $C$15 reference is locked with dollar signs, so it still points at total actual income when you copy the formula down. In F19 enter the status flag:
=IF(C19="","",IF(C19>B19,"Over","OK"))
Copy all three formulas down to row 30. A positive number in column D means you are under budget. A negative number means you overspent.
Step 5: Add the totals and what is left
In row 32 use =SUM(B19:B30) for budget, the same for actual in C32 and for left in D32. In E32 enter =IF($C$15=0,"",C32/$C$15) and in F32 enter =IF(C32>B32,"Over","OK"). Then add B34 as =B15-B32 for the planned left over and C35 as =C15-C32 for the actual left over.
Step 6: Color the Over and OK flags
Select F19:F32, then choose Format > Conditional formatting. Add one rule where the text is exactly Over and set a red bold font. Add a second rule where the text is exactly OK and set a green bold font. Now overspending stands out without reading a single number.
Step 7: Add the cards and the chart
The four cards read straight from the totals: income is =C15, spending is =C32, left over is =C15-C32, and left over as a share of income is =IF(C15=0,0,(C15-C32)/C15). For the chart, select A18:C30, choose Insert > Chart and pick a bar chart. Google Sheets draws budget and actual for each category, and the chart updates whenever you change a number.
Worked example with the sample figures
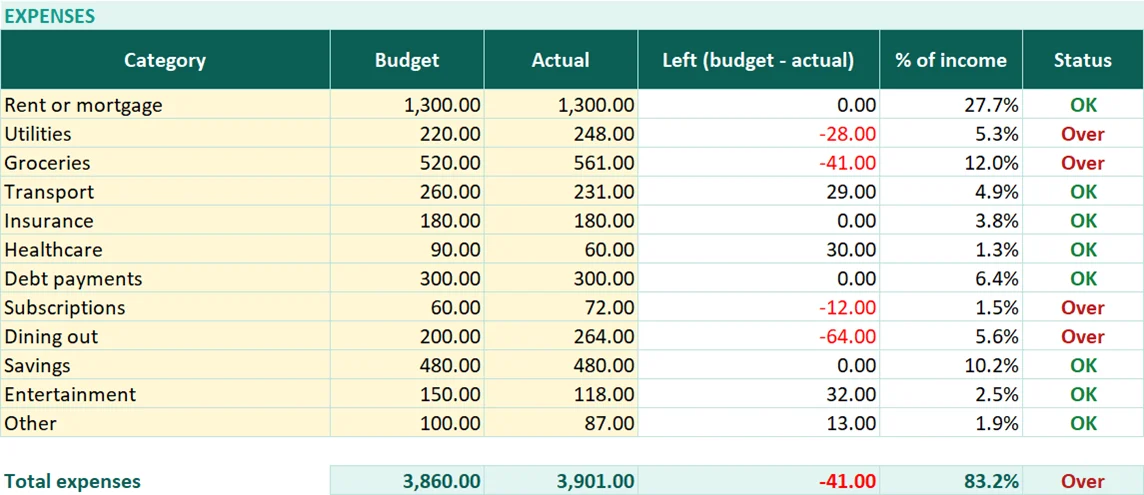
The template comes filled in so you can check the logic. Planned income is 4,840.00 and actual income is 4,688.00, so the income difference in D15 is -152.00. Most of that gap is side income, which came in at 450 against a plan of 600.
On the expense side, planned spending in B32 is 3,860.00 and actual spending in C32 is 3,901.00. That is 83.2% of actual income, and the overall status in F32 reads Over because the total is 41.00 above plan.
| Category | Budget | Actual | Left | Status |
|---|---|---|---|---|
| Utilities | 220.00 | 248.00 | -28.00 | Over |
| Groceries | 520.00 | 561.00 | -41.00 | Over |
| Subscriptions | 60.00 | 72.00 | -12.00 | Over |
| Dining out | 200.00 | 264.00 | -64.00 | Over |
Those four lines are 145.00 over plan in total. Transport, healthcare, entertainment and other came in 104.00 under plan, which is why the net result is only 41.00 over. Actual left over in C35 is 787.00, against a planned 980.00 in B34. As a share of income, 787 out of 4,688 is 16.8%, which is the figure on the last card.
To see the sheet react, change dining out in C27 to 200. The row turns green, the total drops by 64.00 and actual left over rises to 851.00.
How to adapt the template to your own money
- Rename the twelve expense categories in
A19:A30to match how you actually spend, and delete the sample amounts before you start. - Use the two blank income rows in
A13:A14for a partner’s pay, rental income or a seasonal job. - Plan with last month’s actuals. Copy the previous tab, clear the Actual column and set new budgets from what really happened.
- Keep irregular costs such as car service or gifts in one category and budget a twelfth of the yearly amount each month.
- Check the left over share on the fourth card against a target you choose. Many people use a rule of thumb such as spending 50% on needs, 30% on wants and putting 20% toward savings, but your own numbers matter more than any rule.
- Duplicate the Budget tab each month and rename it, for example Nov 2026, so you keep a simple history.
Common mistakes
- Typing over formulas. Only edit the yellow cells. If you overwrite
D19orF19, that row stops updating. - Budgeting what you hope to spend. Start from real past spending, then adjust. A budget nobody can follow turns every row red.
- Forgetting small recurring costs. Subscriptions look small but add up. A dedicated line makes them visible.
- Leaving Actual blank. A blank Actual shows no status on purpose. Enter the real amount to see Over or OK.
- Counting savings twice. Savings is a spending line here, so left over is what remains after savings, not on top of it.
- Entering a percentage as a whole number. Column E is a formula. You never type into it.
- Never reviewing it. Spend ten minutes at the end of each month to fill in Actual and note which lines drifted.
Excel vs Google Sheets notes
| Task | Excel | Google Sheets |
|---|---|---|
| Open the file | Open directly | Drive > New > File upload, or File > Import |
| Color the status flags | Conditional Formatting rules | Format > Conditional formatting |
| Add the chart | Insert > Charts | Insert > Chart |
| Formulas | All work as written | All work as written |
The formulas are the same in both programs, so the budget behaves the same way wherever you open it. If the chart looks slightly different after you upload the file to Google Sheets, that is a styling difference only. The numbers are unchanged.
Keep going
A budget is the first layer of a money system. If you are paying down loans, try the debt snowball spreadsheet and the mortgage calculator in Excel. If you want to see where savings could go, the compound interest calculator shows growth with monthly contributions. For a small business, the cash flow forecast template and the profit and loss template cover the business side. These are educational tools, not financial advice. More files are on the free templates page, and the start here guide shows where to begin.
If you want a more polished planner with more features, the Monthly Budget Plan Template in Google Sheets is an option. For now, download the free file, replace the sample figures with last month’s real numbers and see where your money went.
Frequently asked questions
How do I make a monthly budget in Google Sheets?
List your income and expense categories, add a Budget column and an Actual column, then use formulas to subtract. In this template the left column is =IF(C19="","",B19-C19) and the status flag is =IF(C19="","",IF(C19>B19,"Over","OK")). Add conditional formatting to color the flags and Insert > Chart for the bar chart.
Is this monthly budget template free?
Yes. The template is free to download, with no sign-up. It is an Excel file that also opens in Google Sheets through File upload in Drive or File > Import.
How do I compare budget vs actual in a spreadsheet?
Put planned amounts in one column and real amounts in the next, then subtract. Budget minus actual gives the amount left in each category, and a simple IF formula can show Over when actual is higher than budget.
Can I use it for more than one month?
Yes. Right-click the Budget tab, choose Duplicate, rename the copy to the month and clear the Actual column. Each tab then keeps its own record.
Does the template give financial advice?
No. It is an educational spreadsheet that does the arithmetic on figures you enter. It does not recommend how much to spend, save or invest.
Free download
Monthly Budget Template (Excel / Google Sheets)
Working formulas, sample data and a How to use sheet. Opens in Excel, or import it into Google Sheets.
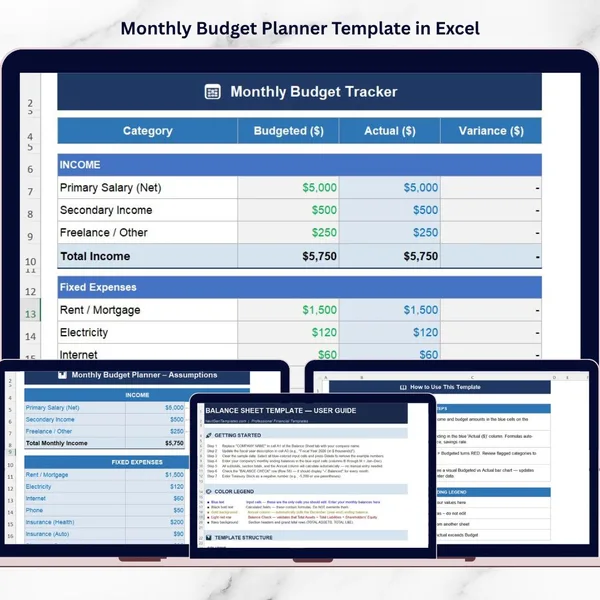
Want the finished version?
Monthly Budget Planner Template in Excel
Plan income and spending and compare budget against actual every month.
View the pro template
PK is the founder of PK: An Excel Expert and NextGenTemplates.com and a corporate trainer in Excel, VBA and Power BI. Since 2020 he and his team have built Excel and Google Sheets tutorials and templates for business users.
Education only. Not financial, tax or investment advice.