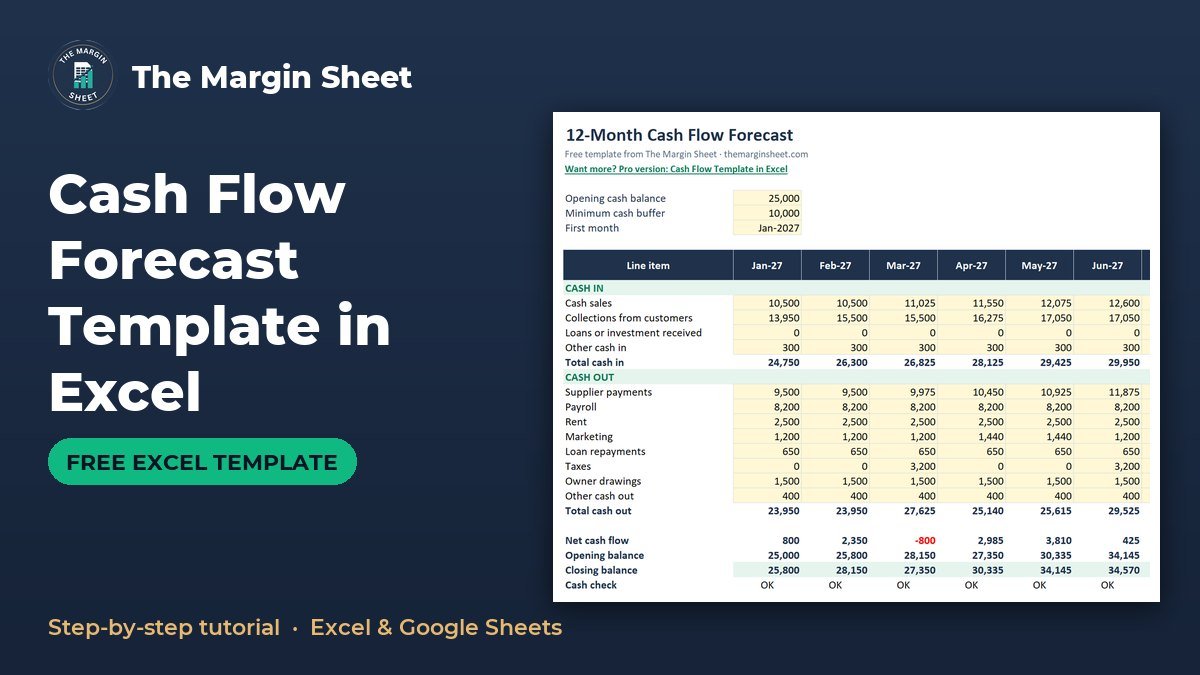
A cash flow forecast template in Excel lists the cash you expect to receive and pay out each month, then carries the closing balance forward as next month’s opening balance. To build one, enter an opening balance, a minimum cash buffer and a start month, fill in the cash in and cash out rows, and let formulas calculate net cash flow and closing balance for 12 months. The free template is below, already set up with sample figures.
Free download
12-Month Cash Flow Forecast (Excel)
Working formulas, sample data and a How to use sheet. Opens in Excel, or import it into Google Sheets.
What this cash flow forecast template does
The workbook has two sheets: ‘How to use’ and ‘Cash Flow’. The ‘Cash Flow’ sheet is a 12-month cash flow forecast that starts in January 2027 and runs to December 2027, with a Total column in N.
It suits small business cash flow planning for owners, freelancers and anyone who needs to see whether the bank balance will cover the next few months. It also flags any month where cash falls below a buffer you choose, so you see a problem before it arrives.
The key idea is to record cash when it actually moves in or out of the bank, not when you invoice. A profitable business can still run out of cash if customers pay late while rent and payroll are due on time. If you want the profit view as well, the 12-month profit and loss template is the companion sheet.

The finished sheet reads from top to bottom. Inputs sit at the top, then the month headers, cash in, cash out, net cash flow, the opening and closing balances, and a one-word cash check for every month. A line chart of the closing balance sits alongside, so the shape of the year is visible at a glance.
Who should use a cash flow projection template
Anyone who pays bills from a bank account can use a cash flow projection template. It is most useful when income is uneven or when large costs arrive in single months, such as quarterly taxes. Typical users include:
- Small business owners who need to know if payroll and rent are covered in the coming months.
- Freelancers whose clients pay on different schedules.
- Seasonal businesses that earn more in some months than others.
- Anyone planning to take a loan or make a large purchase and wanting to see the effect on the bank balance.
The forecast is a plan, not a prediction. Its value comes from forcing you to put a month next to every expected payment and receipt.
How to create a cash flow forecast in Excel, step by step
These steps rebuild the template from a blank sheet. Skip them if you just want to use the download.
Step 1: Enter the three inputs
- In
B5type your opening cash balance. The sample uses 25,000. - In
B6type your minimum cash buffer, the lowest balance you are comfortable with. The sample uses 10,000. - In
B7type the first month of the forecast. The sample uses Jan-2027.
Everything else in the sheet depends on these three cells, so changing them updates the whole forecast.
Step 2: Build the month headers in row 9
In B9 enter =B7. In C9 enter =EDATE(B9,1) and copy it across to M9. Format the cells as a month and year, such as Jan-2027. Put the label Total in N9.
Because each header is built from the one before it, you only ever change the start month in B7 and the other eleven months follow.
Step 3: Add the cash in rows (11 to 15)
Label rows 11 to 14 like this:
- Row 11: Cash sales
- Row 12: Collections from customers
- Row 13: Loans or investment received
- Row 14: Other cash in
In row 15, label it Total cash in and enter =SUM(B11:B14) in B15. Copy it across to M15.
Cash sales are sales paid on the spot. Collections from customers are payments for earlier invoices, entered in the month the money is expected to land.
Step 4: Add the cash out rows (17 to 25)
Label rows 17 to 24:
- Row 17: Supplier payments
- Row 18: Payroll
- Row 19: Rent
- Row 20: Marketing
- Row 21: Loan repayments
- Row 22: Taxes (quarterly in the sample)
- Row 23: Owner drawings
- Row 24: Other cash out
In B25 enter =SUM(B17:B24) for Total cash out, and copy it across to M25.
Step 5: Calculate net cash flow
In B27 enter =B15-B25 and copy it across. This is the cash gained or lost in each month. A positive number means the bank balance grew, and a negative number means it shrank.
Step 6: Link opening and closing balances
In B28 enter =$B$5, so January opens with your starting cash. In C28 enter =B29 and copy it across to M28, so each month opens with last month’s closing balance. In B29 enter =B28+B27 and copy it across.
This chain is what makes the sheet a forecast rather than a list. A change in any month flows through to every later month.
Step 7: Add the cash check and totals
In B30 enter:
=IF(B29<0,"Cash runs out",IF(B29<$B$6,"Below buffer","OK"))
Copy it across. The formula returns Cash runs out if the closing balance is negative, Below buffer if it is under the amount in B6, and OK otherwise.
Then add conditional formatting to the closing balance row so it turns red when a balance is under the buffer. Fill column N with totals for the flow rows.
Step 8: Chart the closing balance
Select the month headers and the closing balance row, then insert a line chart. The shape of the line shows where the balance dips faster than a table of numbers does.
Worked example with the sample figures
The sample starts with 25,000 in cash and a 10,000 buffer. Here are the results you will see in the template:
| Month | Result | What it shows |
|---|---|---|
| January | Closing 25,800 | Starts slightly up on the opening balance |
| July | Closing 35,295 | Balance has built up over the first half |
| August | Net cash -3,275 | Seasonal dip begins |
| September | Net cash -7,900, closing 24,120 | Lowest point of the dip |
| December | Closing 35,970 | Balance recovers by year end |
| Full year | Net cash flow +10,970 | Cash grows over the 12 months |
Even in September, the closing balance of 24,120 stays above the 10,000 buffer, so the cash check reads OK. If you raised the buffer above 24,120, September would show Below buffer and the closing balance would turn red.
You can follow the chain by hand. July closes at 35,295. August has net cash of -3,275, so August closes 3,275 lower. September has net cash of -7,900, which brings the closing balance down to 24,120. Each month opens with the previous month’s closing figure, so there is nothing to retype.
The year ends 10,970 ahead, but the August and September drops show why a monthly view matters. A yearly total alone would hide them.
Try a stress test
Once the sample makes sense, change one input and watch the result. Raise the buffer in B6 and see which months flip to Below buffer. Lower the opening balance in B5 and see how far the September low point moves. Delay a collection by one month and notice how the dip changes shape. These quick tests show how much room you really have.
How to adapt this cash flow projection template
- Replace the sample figures. Overwrite the cash in and cash out rows with your own expected amounts, and change
B5,B6andB7. - Rename or add rows. If you have a cost the template does not list, rename Other cash out or insert a row inside the range so the
SUMformulas expand. - Set a buffer that fits you. Many owners pick a figure that covers a set number of weeks of costs. Choose whatever makes you comfortable.
- Time your payments honestly. Use the month customers are expected to pay in Collections from customers, not the invoice month. Put quarterly taxes in the month they leave the bank.
- Link loan payments. If you borrow, take the monthly figure for Loan repayments from the loan amortization schedule in Excel.
- Check your pricing. If the forecast stays tight, the profit margin formula guide helps you test margins and markup.
If debt payments are the main drain on your cash, the debt snowball spreadsheet shows how to plan repayments in a set order.
Build a cautious and a likely version
Save two copies of the file. In one, enter the collections you expect. In the other, push some of those collections a month later. Comparing the two closing balance lines shows how exposed you are to slow-paying customers. Both copies use the same formulas, so only the input rows differ.
Common mistakes
- Using invoice dates. Cash flow tracks money in the bank. Logging a sale when you invoice it overstates your cash.
- Typing over formulas. Rows 15, 25, 27, 28, 29 and 30 should stay as formulas. A typed number in
C28breaks the link to the previous month. - Forgetting irregular payments. Quarterly taxes, annual insurance and owner drawings are easy to miss and cause surprise dips.
- Dropping the dollar sign. Without
$B$5and$B$6, copied formulas point to the wrong cells. - Mixing profit and cash. A purchase paid over several months hits cash at different times than it hits profit.
- Setting the buffer to zero. The check then only warns you once cash is already gone.
- Never updating the sheet. A forecast built once and left alone drifts away from reality within a few months.
Excel vs Google Sheets notes
The template is built in Excel, and the formulas also work in Google Sheets.
| Feature | Excel | Google Sheets |
|---|---|---|
| Month headers | =EDATE(B9,1) works |
Same formula works |
| SUM and IF formulas | Work as written | Work as written |
| Conditional formatting | Home, then Conditional Formatting | Format, then Conditional formatting |
| Line chart | Insert, then Chart | Insert, then Chart |
If the month headers show as numbers after upload, format row 9 as a date. The conditional formatting rule and chart may need a quick check after you import the file.
Keep the forecast current
A forecast is most useful when you update it. At the end of each month, replace the forecast figures with what actually happened, then review the months ahead. Over time you will see which lines you tend to over or underestimate, and your next forecast will be closer.
Browse more sheets on the free templates page, or use the start here guide if you are unsure which one to use first.
If you want a more extensive version, the Cash Flow Template in Excel is available as a paid option. You can also see pro templates by topic.
Your next step: download the file, replace B5, B6 and B7 with your own numbers, then fill in the next three months of expected cash in and cash out.
Frequently asked questions
How do you create a cash flow forecast in Excel?
Enter an opening balance, then list monthly cash in and cash out rows. Calculate net cash flow as total cash in minus total cash out, and set each month's opening balance to the previous month's closing balance. The template above does this across 12 months.
What should a 12 month cash flow forecast include?
It should include an opening balance, cash in (sales, customer collections, loans and other income), cash out (suppliers, payroll, rent, marketing, loan repayments, taxes, drawings) and a closing balance. A minimum cash buffer is also useful so you can see warning months.
What is the difference between cash flow and profit?
Profit counts income and costs when they are earned or incurred, while cash flow counts money when it moves in or out of the bank. A business can show a profit and still run short of cash if customers pay late.
How do I show when cash will run out in Excel?
Use an IF formula on the closing balance, such as =IF(B29<0,"Cash runs out",IF(B29<$B$6,"Below buffer","OK")). Add conditional formatting so balances under your buffer turn red.
Does this cash flow template work in Google Sheets?
Yes, the SUM, IF and EDATE formulas work in Google Sheets. Check that row 9 is formatted as dates and re-check the conditional formatting and chart after importing.
Free download
12-Month Cash Flow Forecast (Excel)
Working formulas, sample data and a How to use sheet. Opens in Excel, or import it into Google Sheets.

Want the finished version?
Cash Flow Template in Excel
Track monthly cash in and out with automatic net cash and closing balance.
View the pro template
PK is the founder of PK: An Excel Expert and NextGenTemplates.com and a corporate trainer in Excel, VBA and Power BI. Since 2020 he and his team have built Excel and Google Sheets tutorials and templates for business users.
Education only. Not financial, tax or investment advice.